
Ohm Analytics released its report on utility benchmarking for solar capacity with data through Q2-2020. The report includes data on utility scale, commercial and residential solar capacity.
The report benchmarked investor-owned utilities in the U.S. four different ways: (1) annual solar capacity (ending Q2-2020), (2) annual solar capacity per customer, (3) cumulative solar capacity and (4) cumulative solar capacity per customer.
The data is an excerpt from Ohm Analytics’ clean energy market intelligence platform, which draws from over 600 data sources and is used by utilities, research firms, distributors, equipment manufacturers and developers. For more information, please use connect with us here.
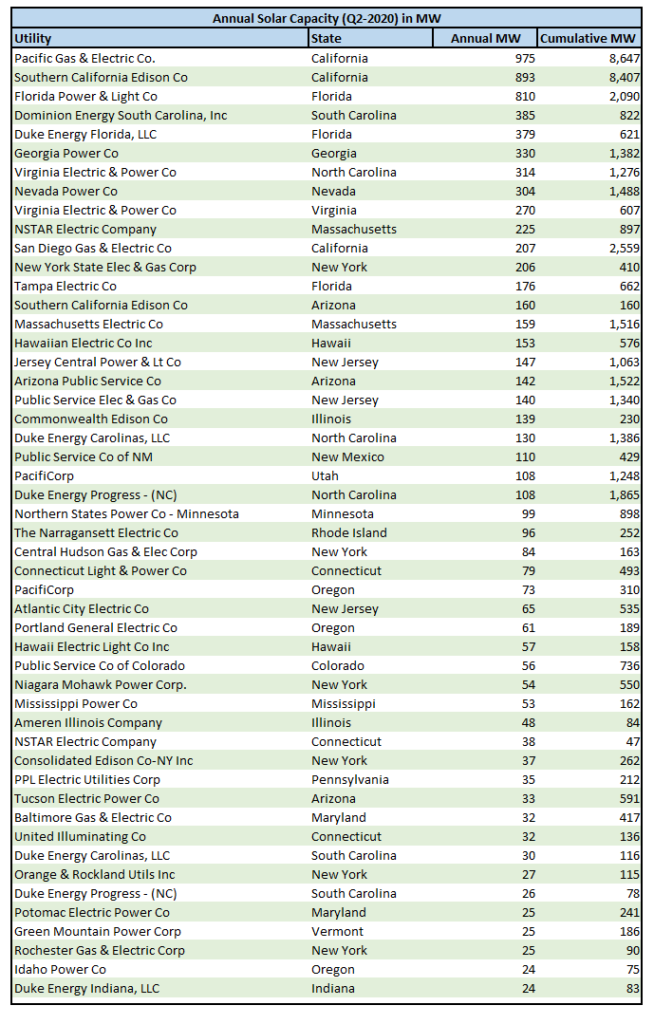
Annual Solar Capacity
PG&E and SCE in CA were ranked #1 and #2 with utilities in FL and other Southeast states significantly increasing solar capacity.
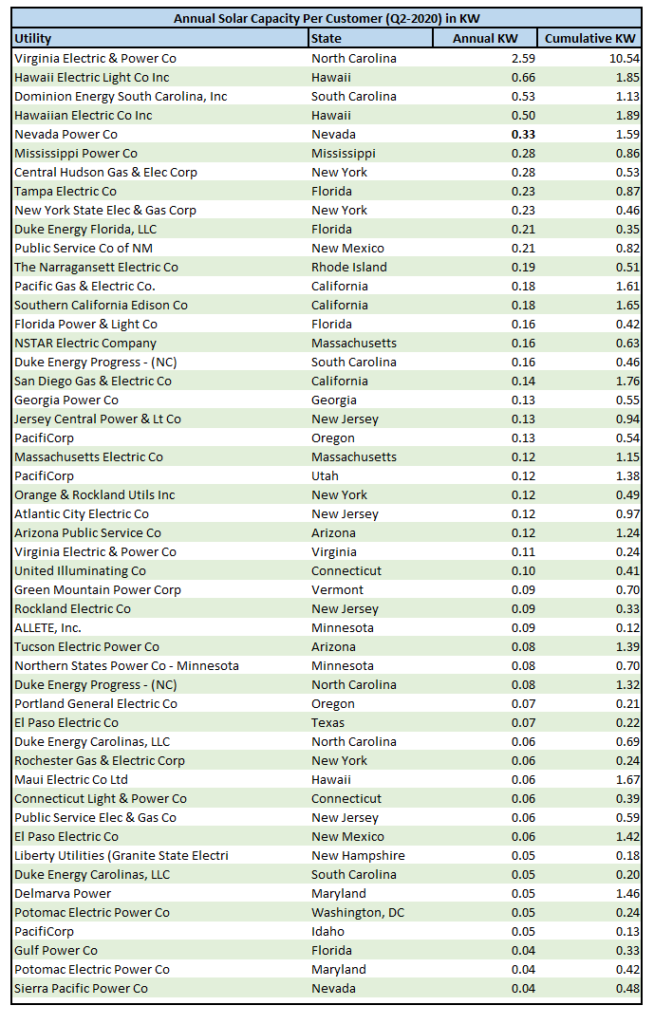
Annual Solar Capacity Per Customer
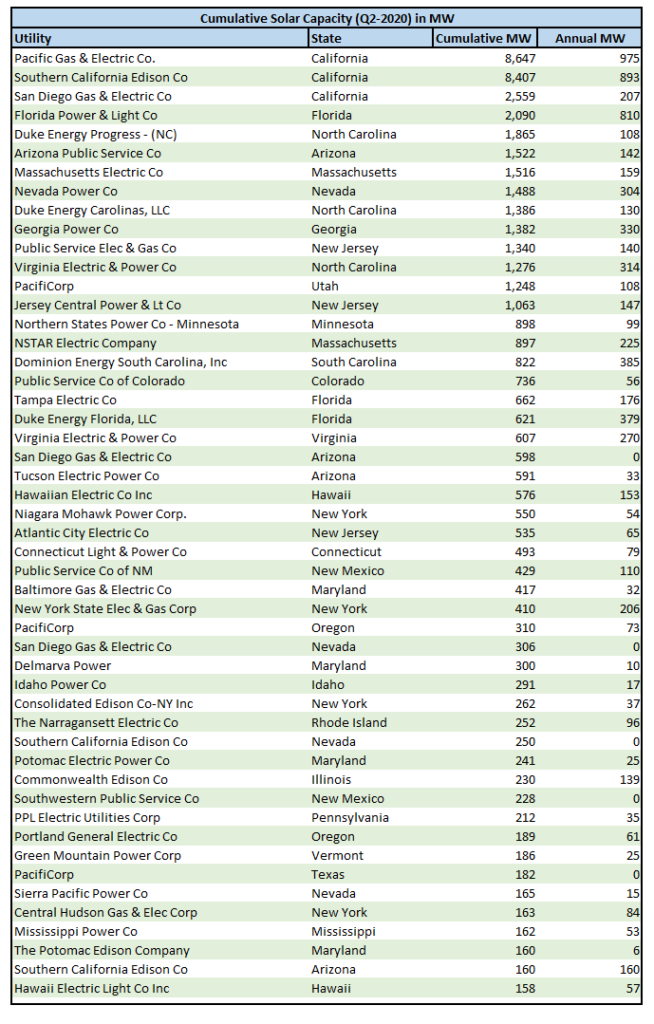
Cumulative Solar Capacity
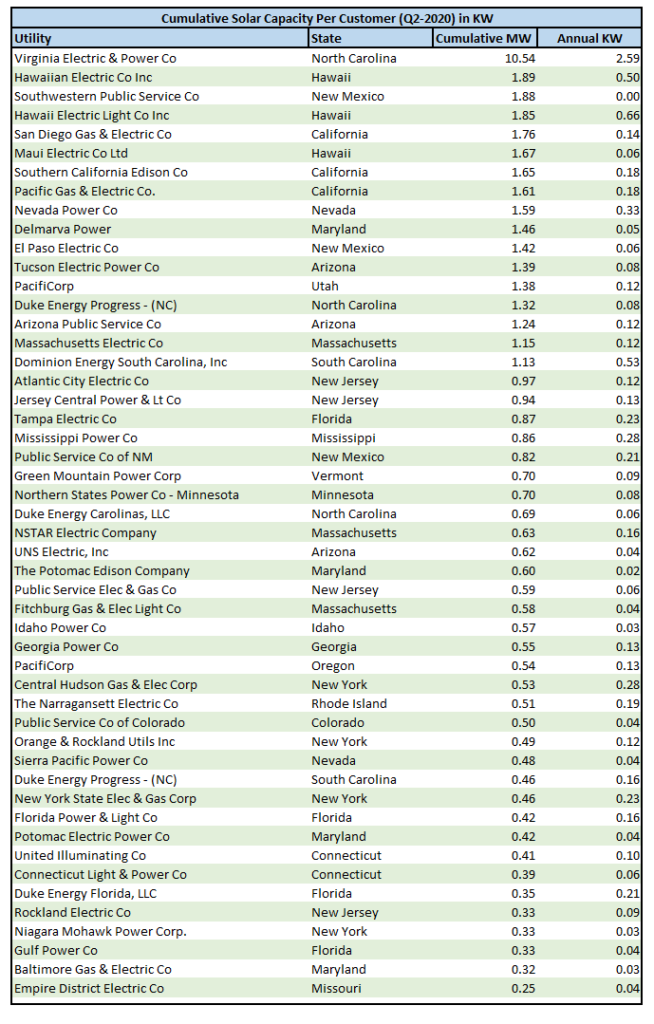
Cumulative Solar Capacity Per Customer
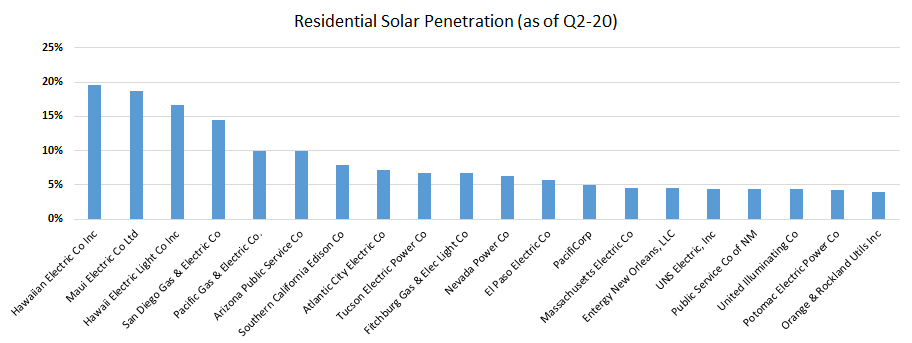
Residential PV Penetration
Hawaii, California and Arizona have reached ~10% residential solar penetration with Hawaii approaching 20%.
Notes and Data Sources:
(1) Data is sourced from EIA reports.
(2) Utility solar capacity is based on nameplate capacity as reported by EIA and small scale solar capacity is as reported by EIA (typically in AC).
(3) Residential PV Penetration is defined as the number of residential PV customers / total residential customers.